
Content Level: Overview / Implementation considerations
Principles and Suitability
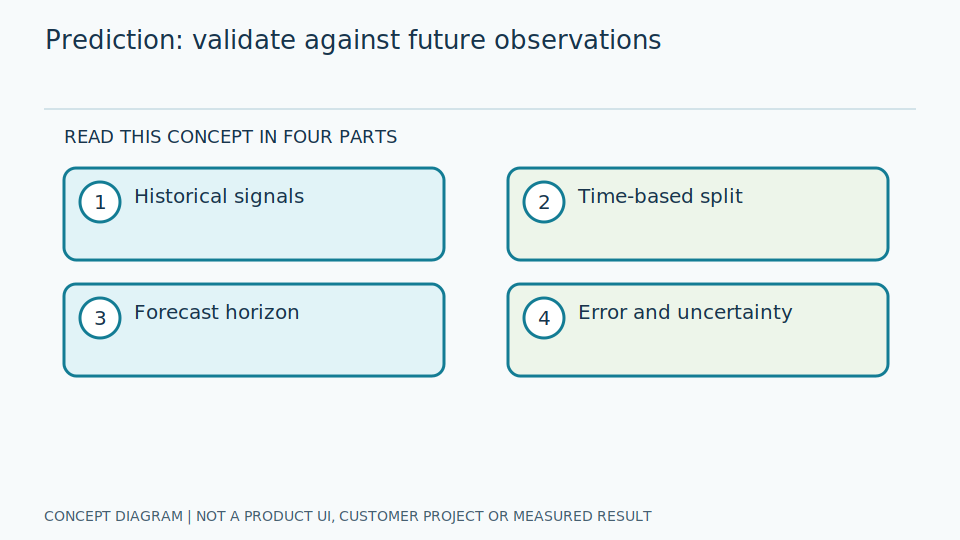
Predictive analytics uses historical data to estimate a future target. Define the prediction horizon and information genuinely available at prediction time. Correlation between gauge values and failure events is not evidence of causation. The task is a specified forward-looking estimate, not certain knowledge of future operation or an automatic justification for intervening in equipment based on a model output.
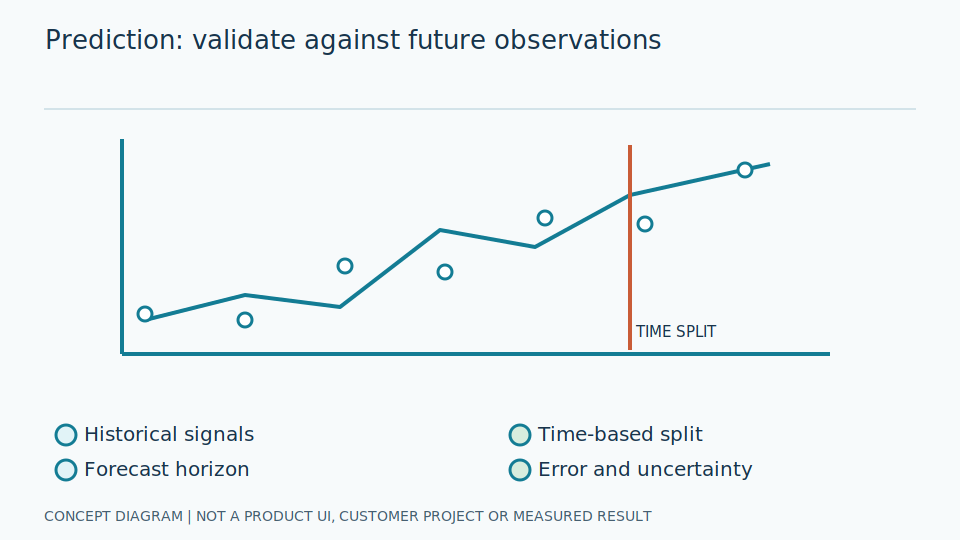
A horizon is how far ahead the prediction looks; changing it changes the problem. Historical times and units must be consistent, and image-reading errors must be distinguished from real process changes. Otherwise the model may learn acquisition faults and issue misleading risk signals. Prediction should answer a defined question, such as the next interval's trend, while acknowledging missing observations and the uncertainty of the estimate.
Engineers define the target and when each feature becomes available. Using maintenance records written after an event to predict before it causes leakage. Walk-forward evaluation trains on earlier periods and checks the next period in order, avoiding future information in method selection. Include a last-value or seasonal baseline to determine whether complexity adds measured benefit rather than merely making the analysis look more sophisticated.
Scroll the diagram horizontally to inspect all details.
Illustrative Industrial Example
Design example: forecast a pressure trend to support inspection planning, not automatic machinery commands. Separate erroneous or missing readings from genuine process changes. The forecast informs responsible personnel within their existing work procedures; it must not be presented as a guaranteed future pressure or an instruction to alter operation without a separate assessment of the decision and its possible consequences.
Suppose a camera outage leaves a gap followed by a different reading. Do not infer an abrupt change between observations without knowing the missing interval. Display incompleteness and any imputation method. Predictions support accountable inspection planning, not advice to change running conditions or induce real faults to demonstrate advance warnings. The distinction between observed measurements and reconstructed values should remain visible to the person interpreting the forecast.
Engineers construct features only from information available by prediction time and retain forecasts with later outcomes without rewriting past predictions. Failure labels need confirmed sources, distinguishing scheduled maintenance from actual breakdowns. Examine each horizon and production condition, with meaningful prediction intervals. Do not send a single number as a certain future value or fill inputs retrospectively using information that never existed at the original decision time.
Study and Trial Workflow
- 1 Define the target, horizon, and labels derived from confirmed events.
- 2 Use walk-forward splits and compare last-value or seasonal baselines.
- 3 Define prediction-interval displays and decisions by accountable personnel.
Evaluation and Metric Definitions
Report MAE by horizon, or precision and recall for advance event warnings, with lead time and prediction-interval coverage. Never feed post-event information backward into earlier predictions. Continuous-value forecasting and event-warning evaluation address different tasks, so success in one should not be used to imply success in the other or to establish operational benefits that have not been separately measured.
Lead time runs from a warning to its matched confirmed event, requiring rules for multiple warnings associated with one event. Interval coverage measures the proportion of actual outcomes inside the predicted ranges; examine width too, since extremely broad intervals may cover outcomes while offering little decision support. Report these definitions and match rules explicitly instead of treating every warning as an independent successful event prediction.
Engineers compare baselines over the same test periods and verify that inputs were genuinely available before outcomes. Separate periods with recipe changes or maintenance and state the number of confirmed events. If there are too few events, disclose uncertainty rather than claim reduced downtime from a tiny sample. Chronological testing supports fair evaluation but does not establish causality or prove that maintenance decisions will automatically deliver benefits.
Limitations and Failure Cases
Failures may be rare, and maintenance schedules can bias labels. Production-recipe changes can invalidate earlier relationships; prediction does not guarantee avoided downtime. The recorded outcome may reflect both equipment behavior and human intervention, so the absence of an observed breakdown is not necessarily proof that a preceding warning was false or that the model prevented the event from happening.
When inspection or repair occurs before failure, an otherwise possible event may never be observed. Record context and avoid simplistic correctness judgments about unobserved outcomes. Data from an earlier operating regime may not represent new recipes or replaced equipment. Review scope rather than taking a forecast curve that matches historical data as proof that the same relationship will continue unchanged under all future production conditions.
More data supports learning but increases timing and quality-management work; complex models may fail under substantially new conditions. Provide insufficient-data states and accountable interpretation. This is planning-support guidance, not confirmation of current product forecasting or unmeasured savings and downtime reductions. Using warnings to command machinery requires an assessment separate from predictive accuracy, because the safety and appropriateness of an intervention are not established by the forecast alone.
Practical Checklist
- Were features genuinely available at prediction time?
- Was evaluation performed in chronological order?
- Who interprets results and makes decisions?