
Principles and Suitable Contexts
Reading a display is a data-capture layer. Measurement quality still depends on installation and sensor principles. It can support trend investigation within the capability of the instrument. A photographed reading alone does not establish compliance with health guidance, exposure limits or legal requirements for the monitored environment.
Temperature describes thermal conditions; relative humidity concerns water vapour relative to saturation at that temperature. Carbon dioxide and particles are different quantities. PM2.5 and PM10 describe particle-size groupings under a measurement method, not gas names. A favourable value for one quantity therefore says nothing conclusive about all environmental conditions. Keep the physical quantity explicit rather than presenting an undifferentiated environmental-quality number.
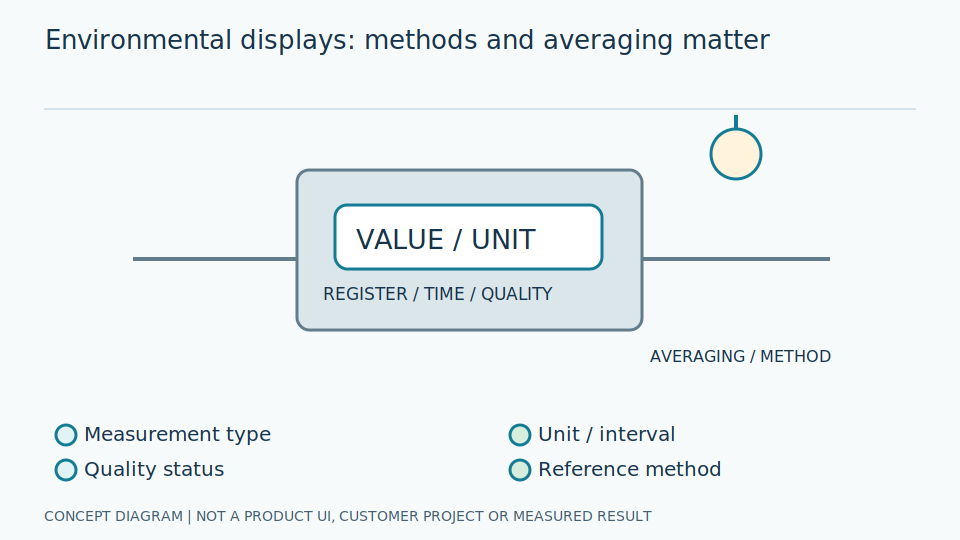
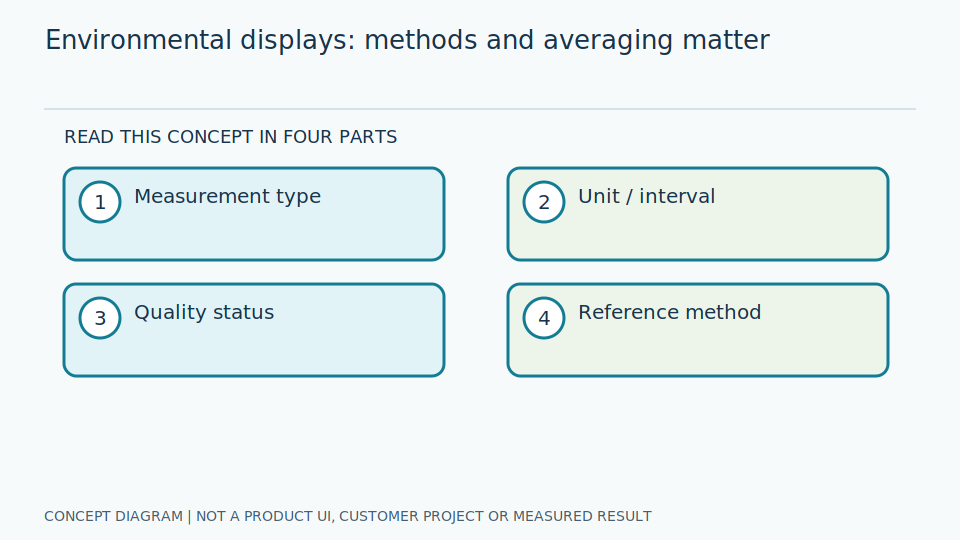
Some instruments estimate particle mass from light scattering using assumptions about the particles, while displays may average measurements over a defined interval. Preserve quantity type, unit and time basis together. Differences across locations can reflect both genuine spatial differences and different sensors. Design comparisons to separate those explanations before drawing trend conclusions; matching image recognition alone does not resolve differences in the underlying measurement methods.
Scroll the diagram horizontally to inspect all details.
Data and Preparation
Record units, averaging period, range and installation location. Distinguish a measured temperature from derived quantities such as heat index. Align capture times with display updates. Arrange comparison periods with a suitable reference instrument at the same location, documenting any relocation that changes what the readings represent.
Map abbreviations and units, clearly separating gas concentrations from particle mass values. Record context such as nearby doors, windows or air outlets without unnecessary personal information. For a whole-room trend question, responsible personnel should help select a representative sampling location rather than simply the easiest camera angle. A convenient screen view cannot compensate for a sensor positioned where it does not represent the intended area.
Choose the required averaging basis before setting image frequency. Sampling faster than a display refresh does not create a new measurement in every frame. For reference comparisons, record shared intervals, locations and conditions, plus authorised relocation or cleaning events. Installation must not block ventilation openings or alter conditions around the sensor, otherwise the camera arrangement itself may change the quantity being studied.
Failure Cases and Limitations
Humidity can interfere with particle sensors, while airflow or direct sunlight can make a location unrepresentative. Rotating pages may switch between PM2.5 and PM10. Values averaged over different periods are not directly comparable. Preserve these distinctions rather than presenting all captured numbers as one continuous equivalent measurement.
An open door or brief activity can change one location without representing the whole building. Retain context before declaring sensor failure or a building-wide problem. If pages alternate between calculated indices and direct measurements, identify each value type. Combining them into one temperature or air-quality channel can mislead users about both units and physical meaning, even when every digit is correctly recognised.
Similar trends do not imply matching values: a fixed bias or humidity-dependent difference may remain. Stale images can conceal environmental changes, so show data age and instrument status. Responsible personnel should investigate through appropriate instrument procedures. Never generate dust, smoke or unsuitable conditions to move readings, and do not use image output alone to diagnose health effects or establish compliance with environmental requirements.
Evaluation Methods
First assess agreement with the displayed value, then examine bias and spread against a reference instrument. Separate results by humidity and measurement range. Report missing data and time coverage, not just intervals where trends agree. Keep reading accuracy distinct from calibration and interpretation of the underlying environmental measurement.
Bias indicates a tendency to read high or low against a reference; spread describes how consistent those differences are. Compare values averaged over matching intervals and identify gaps within each interval. Another reviewer should check quantity type and units on the images, distinguishing a wrong PM channel from differences between particle-measurement methods. This avoids attributing all disagreement to the sensor or all of it to image recognition.
Acceptance must address each studied quantity and the environmental ranges actually represented. Temperature results cannot substitute for gas or particle results. For area surveys, describe location and representativeness. Air-sensor references help design comparisons and interpret limitations; they do not certify health compliance, legal compliance or performance of a photographed instrument. State precisely what was assessed before users generalise a limited comparison.
For multiple locations, include an authorised period with instruments close together before separating them, helping reveal instrument differences. Do not permanently subtract a difference from a short comparison without assessing ranges and conditions. Any correction needs a clear method and applicability boundary, with original readings retained so another reviewer can reconstruct the result and distinguish observed data from adjusted data.
Review Checklist
- Keep the unit and averaging period.
- Record installation location and relocation.
- Separate image-reading results from calibration results.
- Check sensor limitations before drawing health conclusions.
References and Further Reading
References explain principles, not product certification. Requirements from another jurisdiction do not automatically replace local requirements or the actual equipment manual.