
Principles, Scenarios and Suitability
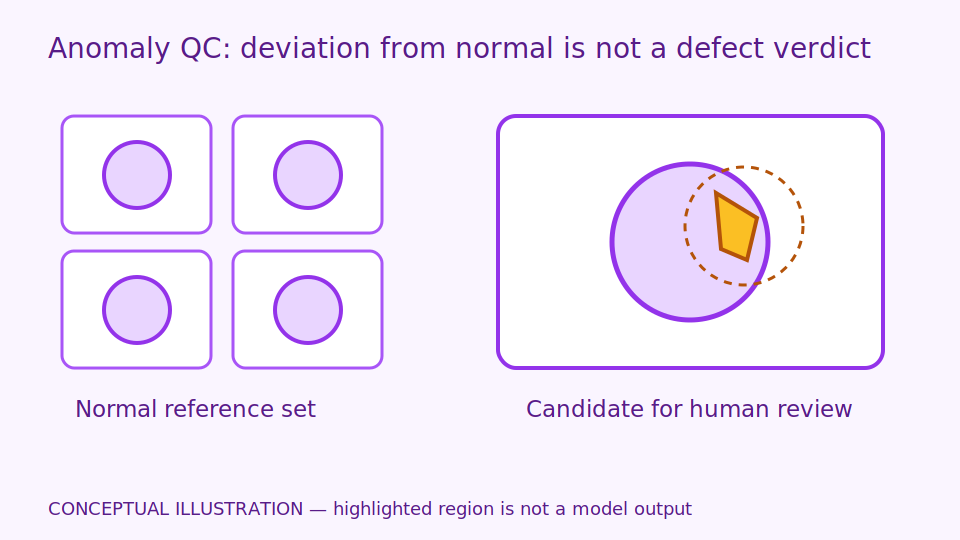
Anomaly detection learns normal appearance and scores differences. It can suit tasks with many good images but rare defects. A high score means deviation from reference data, not proof of a fault; a low score cannot exclude untested defects.
An anomaly differs from the reference pattern, like a person familiar with one product surface noticing an unusual spot but still asking whether damage or changed lighting caused it. A heatmap colours regions with high difference scores. It is neither a physical temperature map nor an explanation of machine faults. Review it alongside the original image and product requirements.
A threshold is the score boundary for referral. Raising it reduces held work but risks missing marks; lowering it increases sensitivity and manual workload. Validation data selects criteria and must be separate from the final test set. Quality owners should choose according to risk and resources, not tune from test results to improve the report. Many good images do not prove detection of all defect types.
Scroll the diagram horizontally to inspect all details.
Illustrative Design Scenario
Illustrative design scenario: learn one product surface from normal batches and show a heatmap for reviewers to categorise causes. Separate changes caused by new lighting from actual product anomalies before adjusting the threshold.
Suppose scores rise across an entire item after a lamp changes, but reviewers find the surface unchanged. Check capture conditions and reference items before moving the threshold. Immediately raising it could hide real marks previously detected. Training on every new image as normal could introduce unreviewed defective examples.
Options are restoring the previous lighting or creating a newly confirmed reference set. The first preserves comparison conditions but restricts station changes; the second adds labelling and testing. Reviewers should distinguish lighting, normal patterns and defects, retaining reasons. Use controlled data and reference items, not damage saleable-line products to create anomalies.
Inputs and Prerequisites
Use reviewed normal images from multiple batches, with lighting and fixture context. Reserve some genuine defects for evaluation. Do not add unreviewed, potentially abnormal images to the normal set.
A fixture positions items and influences their images. Record product model, batch, lighting and who confirmed normal condition. Normal data must cover acceptable variation rather than just attractive images from one day.
Results should include score, heatmap, model version and referral status. Do not name defect classes without classification evidence. Where the cause remains unknown, describe a difference and let people categorise it later.
Trial and Integration Workflow
- 1Review the normal dataset and split it by production batch.
- 2Train only on training data and select thresholds using validation data.
- 3Evaluate held-out defects and arrange review for newly observed anomaly types.
Evaluation and Acceptance Criteria
Report false rejects on normal batches and recall for defects with genuine evidence. Evaluate heatmap localisation separately from image-level decisions. Report the proportion referred to people and do not generalise from a small set to every defect type.
Test batches not used to establish normality or choose score boundaries, reporting counts for each defect type. Image-level results indicate whether a difference was found in the item; location-level results indicate whether the correct area was highlighted. These serve different tasks.
Have reviewers sample low scores and review high scores. Keep unresolved items separate from good ones. Assess actual review-queue workload; do not reduce held results by teaching new differences as normal before responsible personnel approve them.
Scroll the diagram horizontally to inspect all details.
Failure Cases and Limitations
Normal lighting or texture changes may raise scores. Adjusting thresholds on test data makes evaluation optimistic. A heatmap identifies model-sensitive regions; it is not an explanation of the physical cause of an anomaly.
Texture is a surface pattern that may change with materials or processes. A score shift does not prove a quality change. Inspect actual items and their context; do not automatically accuse manufacturers or operators based on the result.
Defects resembling normal appearances may not be highlighted, and internal faults may be entirely invisible. Further learning is a proposed study method, not a capability to detect every unknown fault or certify products from low scores.
Practical Checklist
- Have normal images actually been reviewed for suitability?
- Was the threshold chosen without examining test results?
- Are new anomalies reviewed before reuse in training?