

Principles and Suitable Contexts
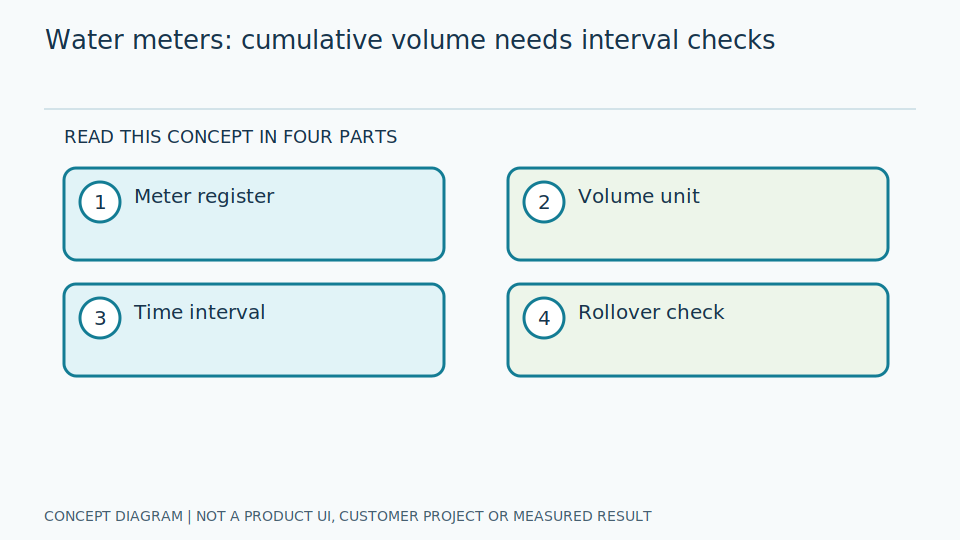
A water meter normally displays cumulative volume. Coloured digits or small dials may represent fractions of a cubic metre. Estimating flow from differences requires the matching elapsed time. Trend monitoring is most useful when the reading interval is long enough relative to the resolution of the meter.
Volume describes total water quantity; flow rate describes volume per unit time. An illustrative increase of 0.2 cubic metres over two hours means 200 litres and an average of 100 litres per hour, not identical flow every minute. Choose the interval for the question: a short difference should not be interpreted as the usage pattern of an entire day.
Visible digit resolution limits the changes that can be observed. Water may pass without advancing to the next readable mark. Preserve fractional units without adding decimal places the image cannot distinguish. OIML volume-measurement and testing concepts provide a framework for understanding instruments; they do not show that the photographed meter or its image-reading system meets those requirements or is approved for a particular use.
Scroll the diagram horizontally to inspect all details.
Data and Preparation
Read the unit and multiplier from the instrument label rather than assuming colours mean the same thing on every model. Arrange lighting without obstructing inspection. Record capture times and known water-use activity, such as shutdown periods, together with meter replacements and relevant valve changes.
Map the area served by the meter, including storage tanks and scheduled activities, so increases have context. Verify decimal digits against the physical label with another recorder before defining difference calculations. Keep identification-label images separate from reading images and avoid unnecessary information. Define how observations will be recorded when a closed cover, condensation or droplets prevent a complete reading.
Questions about inactive periods require actual inactivity times from responsible staff; evening is not automatically a no-use period. Choose sampling intervals around resolution and activity without operating valves to generate examples. Prepare rollover and replacement rules beforehand. Check that reports clearly separate observed quantities from estimated quantities during gaps, preserving the uncertainty rather than presenting interpolated data as continuously measured usage.
Failure Cases and Limitations
Droplets, condensation and covers can obscure the dial. Low flow may not change a visible digit during a short interval, and overnight consumption may have a legitimate cause. An unusual trend is a reason to investigate, not proof of leakage or immediate justification for billing from image-derived data.
A decrease requires checks of digits, fractional positions, timestamps and replacement history before applying rollover rules. After an activity-period gap, the calculated average covers the whole missing interval, not just the latest receipt time. Drawing a continuous graph without showing that gap falsely suggests continuous observation and knowledge of exactly when water was used during the unobserved period.
Unexpected volume may reflect tank filling, system cleaning or an incompletely understood service boundary. Send the observation with its interval and images instead of naming it a leak before site inspection. Decimal mistakes can multiply totals and prompt unnecessary investigations. Confirm units and differences independently before decisions with financial consequences; a plausible-looking trend does not remove the need to verify its measurement basis.
Evaluation Methods
Compare cumulative volume with independently recorded readings and assess interval differences separately. Distinguish reading errors from the performance of the meter. If investigating anomaly detection, use verified incidents and report missed incidents, unnecessary alerts and detection delay, rather than treating every unusual consumption pattern as a confirmed leak.
Check starting and ending quantities using identical images and timestamps, then have another reviewer calculate differences independently to expose multiplier or formula errors. Group results by fractional-digit transitions, condensation, droplets and camera relocation. Explicitly identify reference readings that people cannot clearly resolve; quietly discarding them would make accuracy appear better than users can expect in the actual environment.
Anomaly evaluation must include periods without alerts to identify missed verified incidents. Define verification timing through site procedures and report observations whose causes remain unresolved. Without independent evidence of actual leakage, conclude only how well the method identifies unusual usage intervals. Image-reading agreement alone does not establish leak-detection performance or suitability for charging customers, nor does a short trial validate every operating condition.
Review Checklist
- Confirm fractional digits and units.
- Keep the actual capture times used for differences.
- Record data gaps and meter replacement.
- Investigate the site before concluding why consumption changed.
References and Further Reading
References explain principles, not product certification. Requirements from another jurisdiction do not automatically replace local requirements or the actual equipment manual.