
Principles, Scenarios and Suitability
SCADA integration must preserve timestamps, quality and alarm meaning throughout the data path. Image readings are supplementary observations, not continuously reliable instruments whose unreadable states and uncertainty can be discarded to simplify the display.
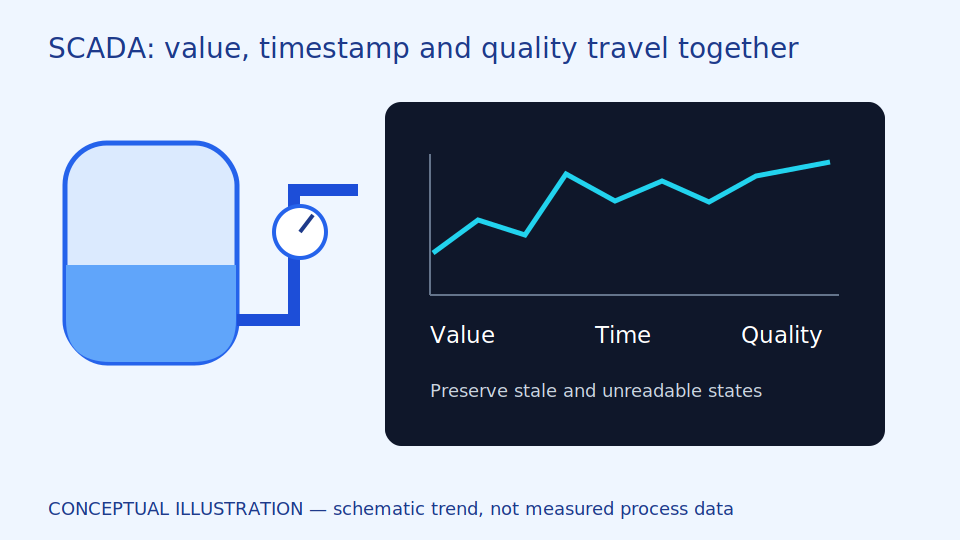
SCADA monitors and manages field information; a historian stores past values. Source time describes when a value applies, while receipt time describes delivery. A smooth chart may simply hold the last value rather than show continuous measurements. Read quality alongside trends and distinguish no data from a measured zero.
Quality mapping translates status between systems and must preserve obstruction or unreadability through the connector. An alarm philosophy defines which events require warning and who responds. Adding tags without those rules can increase alarm workload. Start with clearly useful read-only points and retain the original sources for comparison before using the new observations in decisions.
Scroll the diagram horizontally to inspect all details.
Illustrative Design Scenario
Illustrative design scenario: an image-derived gauge value enters a historian with source time and bad quality when the image is obstructed. The SCADA display shows a gap or warning instead of extending the last reading as though measurements were continuing.
Suppose morning readings arrive after a network recovers in the afternoon. Backfill places records into historical gaps. Use their morning timestamps and mark delayed arrival; do not automatically turn historical events into current alarms. A complete historical graph cannot restore the opportunity to respond during the morning outage.
Keeping every interval uses more storage; compressing small changes may hide short variations the task needs. Process owners should choose for the intended use. Operators should review sample trends and quality from test data rather than creating abnormal live process conditions to test the integration.
Inputs and Prerequisites
Prepare tag names, units, source timestamps, quality mappings, an alarm philosophy and historian policies. Verify whether the connector actually transmits quality flags and historical records.
Identify each tag's instrument, units and timestamp source, including time zone or a common time convention. Retain raw readings before conversion and the quality-code table agreed by both systems. This permits tracing a displayed value back through each transformation.
Transmit value, time and quality together. If the destination accepts numbers only, design a separate status channel or reject that route for decisions requiring freshness information. Discarding limitations to make a connection succeed would misrepresent what the data can establish.
Trial and Integration Workflow
- 1Map tags and read/write permissions, starting with read-only access.
- 2Test quality codes and time synchronisation from source through to historian.
- 3Test buffering and backfill without turning historical alarms into new events.
Evaluation and Acceptance Criteria
Reconcile time-based values and event order from the source to the screen. Rehearse duplicates and clock corrections. Separate data freshness, loss and alarm correctness in acceptance criteria rather than treating one successful connection as proof of integration quality.
Send normal, unreadable and backward-timestamped samples through a test system. Compare historian and screen quality states. A connection that reports success but converts bad quality into normal data has not passed the intended requirement.
Ask users to trace sample values from source image to report and explain gaps. Check record counts after retries and reconnection. Verify that neither duplicate rows nor duplicate events are introduced unintentionally, including when older records are delivered after newer ones.
Scroll the diagram horizontally to inspect all details.
Failure Cases and Limitations
Backfill can repair historical gaps but cannot recover the time lost in responding to an event. Excessive polling can affect old equipment. A SCADA display does not establish that the image system is suitable for a protective loop or has any certification.
Polling requests values at intervals; it does not cause a new physical measurement each time. Check how often the source actually updates. Polling faster may return repeated values without adding useful information, while still consuming communication resources.
Write permissions and existing alarms remain under the system owner. Images provide a proposed supplementary observation source, not an upgrade to the reliability of control or protection functions. Review the mapping and limitations again whenever instruments change.
Practical Checklist
- Are source and receipt times clearly distinct?
- Does unreadable quality remain visible at the display?
- Can backfill avoid unintended retrospective alarms?